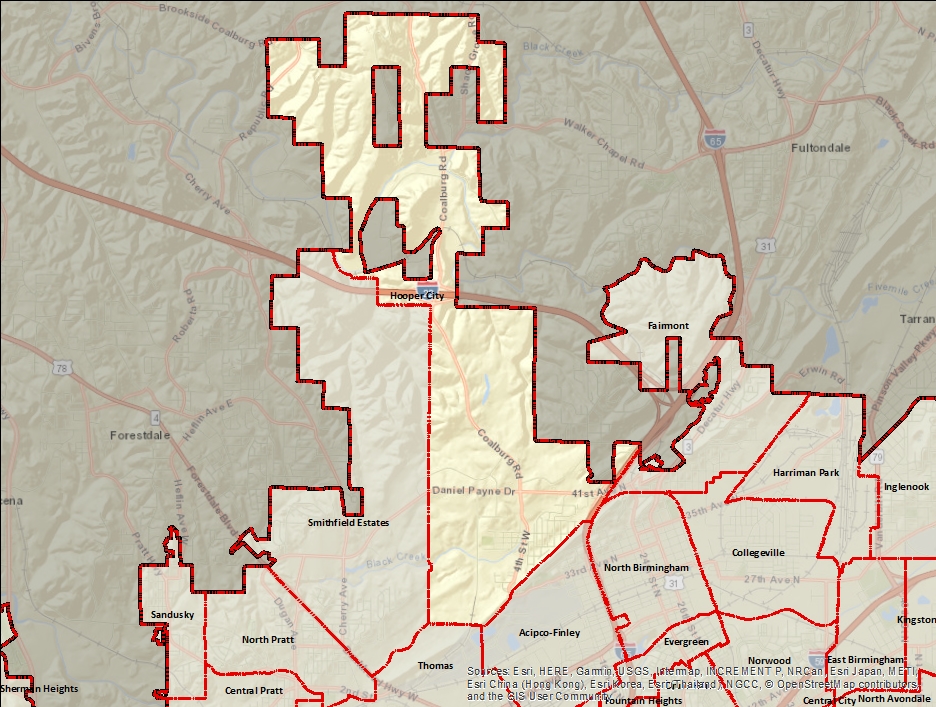
Hooper City
Hooper City is a neighborhood in the North Birmingham community which stretches along the northern edges of the city on either side of Coalburg Road west of I-65 between the City of Fultondale and the Jefferson County Forestdale community. The neighborhood borders Fairmont to the southeast, Acipco-Finley and Thomas to the south, and Smithfield Estates to the west. Much of the neighborhood is undeveloped, with no schools or public buildings within its borders.
Indicator Details
|
Indicators |
Primary Domain | Indicator Value | Rank | Tier | Indicator Weight |
|---|---|---|---|---|---|
| Walkability | Neighborhood Characteristics | 33.8 | 68 | Bottom | 4.00 |
| Voter Participation | Social Cohesion | 4.9% | 63 | Middle | 1.00 |
| Visual Property Nuisances | Blight | 22.4% | 72 | Bottom | 5.00 |
| Violent Crime | Health Systems and Public Safety | 122.8 | 67 | Bottom | 4.00 |
| Vacancy Rates | Housing | 25.6% | 77 | Bottom | 1.00 |
| Tree Cover | Natural Areas | 60.8% | 7 | Top | 1.00 |
| Travel Time to Work | Employment Opportunities | 25.9 | 63 | Middle | 1.00 |
| Transit Accessibility | Transportation | 2.4 | 75 | Bottom | 4.00 |
| Toxic Releases from Facilities | Environmental Hazards | 69.3% | 40 | Middle | 1.00 |
| Tax Delinquent Properties | Blight | 31.3% | 90 | Bottom | 5.00 |
| School Readiness Scores | Educational Opportunities | -% | - | Data N/A | 1.00 |
| School Proximity to Traffic | Environmental Hazards | 0.0% | 1 | Top | 1.00 |
| Residential Proximity to Traffic | Environmental Hazards | 3.9% | 75 | Bottom | 1.00 |
| Residential Mobility | Social Cohesion | 88.1% | 27 | Top | 1.00 |
| Reading Proficiency | Educational Opportunities | 14.7% | 36 | Middle | 3.00 |
| Public Health Nuisances | Health Systems and Public Safety | 190.6 | 97 | Bottom | 4.00 |
| Public Assisted Households | Employment Opportunities | 63.6% | 81 | Bottom | 1.00 |
| Proximity to Superfund Sites | Environmental Hazards | 0.0% | 1 | Top | 1.00 |
| Proximity to Brownfield Sites | Environmental Hazards | 0.0% | 1 | Top | 1.00 |
| Preventable Hospitalizations | Health Systems and Public Safety | - | - | Data N/A | 1.00 |
| Preschool Enrollment | Educational Opportunities | 1.1% | 84 | Bottom | 3.00 |
| Pedestrian Connectivity | Transportation | 8 | 97 | Bottom | 4.00 |
| Pedestrian & Bicycle Injuries by Motor Vehicles | Health Systems and Public Safety | 0.5 | 81 | Bottom | 4.00 |
| Payday Loans | Economic Health | 3 | 89 | Bottom | 1.00 |
| Offsite Alcohol Outlets | Neighborhood Characteristics | 0 | 1 | Top | 1.00 |
| Motor Vehicle Collisions | Health Systems and Public Safety | 36.6 | 94 | Bottom | 4.00 |
| Low Birth Weight | Health Systems and Public Safety | -% | - | Data N/A | 1.00 |
| Long-Term Unemployment | Employment Opportunities | 1.7% | 16 | Top | 1.00 |
| Local Business Vitality | Economic Health | 40.0% | 88 | Bottom | 1.00 |
| Land Use Mix | Neighborhood Characteristics | 0.7 | 9 | Top | 1.00 |
| Infant Mortality Rate | Health Systems and Public Safety | 10.1 | 25 | Top | 1.00 |
| Household Transportation Costs | Transportation | 28.0% | 92 | Bottom | 4.00 |
| High School Graduation Rate | Educational Opportunities | 80.9% | 14 | Top | 3.00 |
| Food Desert | Neighborhood Characteristics | 42.9% | 11 | Top | 2.00 |
| Excessive Housing Cost Burden | Housing | 41.4% | 53 | Middle | 1.00 |
| Employment Rate | Employment Opportunities | 82.6% | 62 | Middle | 1.00 |
| Commute Mode Share | Transportation | 15.4% | 53 | Middle | 4.00 |
| Chronic School Absence | Health Systems and Public Safety | 24.6% | 49 | Middle | 1.00 |
| Business Retention | Economic Health | -2.8% | 33 | Top | 1.00 |
| Blood Lead Levels in Children | Housing | -% | - | Data N/A | 1.00 |
| Age of Housing | Housing | 90.7% | 81 | Bottom | 1.00 |
| Adult Educational Attainment | Educational Opportunities | 70.8% | 83 | Bottom | 3.00 |
| Access to Parks and Open Space | Natural Areas | 87.5% | 64 | Middle | 1.00 |
| Access to Mainstream Financial Services | Economic Health | 60.1% | 7 | Top | 1.00 |
| Abandoned Structures | Blight | 11.4% | 50 | Middle | 5.00 |
Demographic and Contextual Indicators
| Neighborhood | City Wide | |
|---|---|---|
| Racial and Ethnic Diversity | 0.2 | 0.44 |
| Population | 664 | 210,616 |
| Park Quality | 60.8 | |
| Life Expectancy | 72.1 | 78.8 |
| Income Inequality | 0.4 | 0.49 |
| Concentrated Poverty | 25.9% | 30.9% |