South Woodlawn
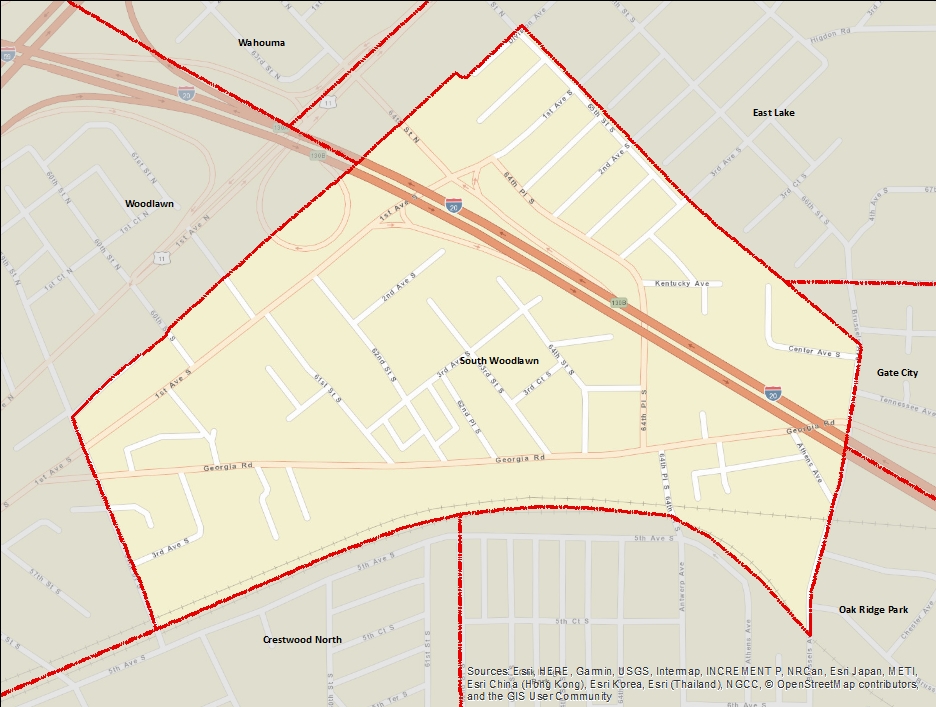
South Woodlawn is a small neighborhood in the Woodlawn community of eastern Birmingham. It is bounded by 59th Street South to the west and Brussels Avenue to the east. The neighborhood is defined by the Norfolk Southern Railway's East End District tracks to the south and Division Avenue and 65th Street South to the north. Most of South Woodlawn is accessible from Georgia Road, with a disconnected area across I-20 hugging 64th Place South and Kentucky Avenue. Neighborhoods abutting South Woodlawn include Woodlawn, East Lake, Gate City, Oak Ridge Park and Crestwood North.
Indicator Details
| Indicators |
Primary Domain |
Indicator Value | Rank | Tier | Indicator Weight |
|---|---|---|---|---|---|
| Business Retention | Economic Health | -8.0% | 47 | Middle | 1.00 |
| Access to Mainstream Financial Services | Economic Health | 20.6% | 85 | Bottom | 1.00 |
| Local Business Vitality | Economic Health | 47.8% | 76 | Bottom | 1.00 |
| Payday Loans | Economic Health | 1.6 | 77 | Bottom | 1.00 |
| Reading Proficiency | Educational Opportunities | 10.0% | 68 | Bottom | 3.00 |
| Adult Educational Attainment | Educational Opportunities | 65.6% | 96 | Bottom | 3.00 |
| High School Graduation Rate | Educational Opportunities | 72.4% | 86 | Bottom | 3.00 |
| School Readiness Scores | Educational Opportunities | -% | - | Data N/A | 1.00 |
| Preschool Enrollment | Educational Opportunities | 95.6% | 1 | Top | 3.00 |
| Residential Proximity to Traffic | Environmental Hazards | 11.0% | 87 | Bottom | 1.00 |
| Proximity to Brownfield Sites | Environmental Hazards | 0.0% | 1 | Top | 1.00 |
| School Proximity to Traffic | Environmental Hazards | 0.0% | 1 | Top | 1.00 |
| Proximity to Superfund Sites | Environmental Hazards | 0.0% | 1 | Top | 1.00 |
| Toxic Releases from Facilities | Environmental Hazards | 0.0% | 1 | Top | 1.00 |
| Public Assisted Households | Employment Opportunities | 91.6% | 95 | Bottom | 1.00 |
| Employment Rate | Employment Opportunities | 84.9% | 47 | Middle | 1.00 |
| Long-Term Unemployment | Employment Opportunities | 4.5% | 67 | Bottom | 1.00 |
| Travel Time to Work | Employment Opportunities | 21.3 | 31 | Top | 1.00 |
| Vacancy Rates | Housing | 27.6% | 83 | Bottom | 1.00 |
| Age of Housing | Housing | 69.3% | 16 | Top | 1.00 |
| Blood Lead Levels in Children | Housing | -% | - | Data N/A | 1.00 |
| Excessive Housing Cost Burden | Housing | 42.4% | 58 | Middle | 1.00 |
| Pedestrian & Bicycle Injuries by Motor Vehicles | Health Systems and Public Safety | 0.5 | 81 | Bottom | 4.00 |
| Public Health Nuisances | Health Systems and Public Safety | 147 | 93 | Bottom | 4.00 |
| Infant Mortality Rate | Health Systems and Public Safety | 9.3 | 20 | Top | 1.00 |
| Violent Crime | Health Systems and Public Safety | 140.6 | 74 | Bottom | 4.00 |
| Chronic School Absence | Health Systems and Public Safety | 28.1% | 67 | Bottom | 1.00 |
| Low Birth Weight | Health Systems and Public Safety | -% | - | Data N/A | 1.00 |
| Motor Vehicle Collisions | Health Systems and Public Safety | 19.7 | 85 | Bottom | 4.00 |
| Preventable Hospitalizations | Health Systems and Public Safety | - | - | Data N/A | 1.00 |
| Tree Cover | Natural Areas | 0.0% | 77 | Bottom | 1.00 |
| Access to Parks and Open Space | Natural Areas | 73.6% | 76 | Bottom | 1.00 |
| Walkability | Neighborhood Characteristics | 79.5 | 13 | Top | 4.00 |
| Land Use Mix | Neighborhood Characteristics | 0.5 | 64 | Middle | 1.00 |
| Offsite Alcohol Outlets | Neighborhood Characteristics | 0 | 1 | Top | 1.00 |
| Food Desert | Neighborhood Characteristics | 83.3% | 49 | Middle | 2.00 |
| Residential Mobility | Social Cohesion | 80.2% | 66 | Middle | 1.00 |
| Voter Participation | Social Cohesion | 6.3% | 36 | Middle | 1.00 |
| Transit Accessibility | Transportation | 5.3 | 43 | Middle | 4.00 |
| Commute Mode Share | Transportation | 39.5% | 4 | Top | 4.00 |
| Household Transportation Costs | Transportation | 22.6% | 19 | Top | 4.00 |
| Pedestrian Connectivity | Transportation | 197 | 2 | Top | 4.00 |
| Abandoned Structures | Blight | 16.0% | 71 | Bottom | 5.00 |
| Tax Delinquent Properties | Blight | 26.5% | 76 | Bottom | 5.00 |
| Visual Property Nuisances | Blight | 31.1% | 93 | Bottom | 5.00 |
Demographic and Contextual Indicators
| Neighborhood | City Wide | |
|---|---|---|
| Income Inequality | 0.4 | 0.49 |
| Concentrated Poverty | 34.0% | 30.9% |
| Life Expectancy | 71.6 | 78.8 |
| Population | 626 | 210,616 |
| Racial and Ethnic Diversity | 0.3 | 0.44 |
| Park Quality | 38.1 |