Thomas
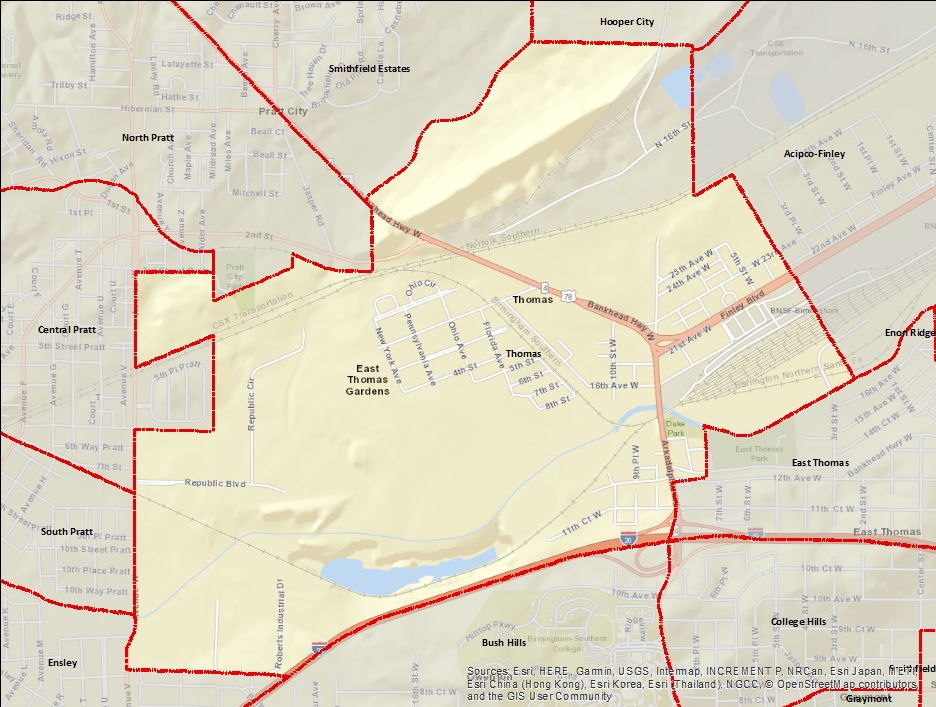
Thomas is a neighborhood in Birmingham's Pratt community. It is located north of I-59/20, west of Acipco-Finley and southeast of North Pratt. A former municipality, Thomas was began as a plantation but was purchased by David Thomas for the construction of the Thomas Furnaces in the late 1880s. The first worker homes built in Thomas by the Pioneer Corporation were modeled after those in factory towns in Pennsylvania. After the operation was purchased by Republic Steel in 1899 more typical house plans were adopted, including shotgun, square-top and bungalow-style houses.
Indicator Details
| Indicators | Primary Domain | Indicator Value |
Rank |
Tier | Indicator Weight |
|---|---|---|---|---|---|
| Blood Lead Levels in Children | Housing | -% | - | Data N/A | 1.00 |
| Low Birth Weight | Health Systems and Public Safety | -% | - | Data N/A | 1.00 |
| School Readiness Scores | Educational Opportunities | -% | - | Data N/A | 1.00 |
| Preventable Hospitalizations | Health Systems and Public Safety | - | - | Data N/A | 1.00 |
| Proximity to Brownfield Sites | Environmental Hazards | 0.0% | 1 | Top | 1.00 |
| School Proximity to Traffic | Environmental Hazards | 0.0% | 1 | Top | 1.00 |
| Land Use Mix | Neighborhood Characteristics | 0.7 | 9 | Top | 1.00 |
| Reading Proficiency | Educational Opportunities | 18.5% | 14 | Top | 3.00 |
| Toxic Releases from Facilities | Environmental Hazards | 30.9% | 21 | Top | 1.00 |
| Public Assisted Households | Employment Opportunities | 28.1% | 23 | Top | 1.00 |
| Commute Mode Share | Transportation | 23.7% | 25 | Top | 4.00 |
| Transit Accessibility | Transportation | 6.9 | 26 | Top | 4.00 |
| Access to Parks and Open Space | Natural Areas | 99.8% | 34 | Middle | 1.00 |
| Age of Housing | Housing | 79.1% | 35 | Middle | 1.00 |
| Excessive Housing Cost Burden | Housing | 36.8% | 36 | Middle | 1.00 |
| Tax Delinquent Properties | Blight | 15.0% | 37 | Middle | 5.00 |
| Walkability | Neighborhood Characteristics | 63 | 41 | Middle | 4.00 |
| Voter Participation | Social Cohesion | 5.7% | 44 | Middle | 1.00 |
| Chronic School Absence | Health Systems and Public Safety | 23.9% | 45 | Middle | 1.00 |
| Business Retention | Economic Health | -7.9% | 46 | Middle | 1.00 |
| Tree Cover | Natural Areas | 4.8% | 50 | Middle | 1.00 |
| High School Graduation Rate | Educational Opportunities | 78.0% | 50 | Middle | 3.00 |
| Visual Property Nuisances | Blight | 15.2% | 54 | Middle | 5.00 |
| Adult Educational Attainment | Educational Opportunities | 77.3% | 55 | Middle | 3.00 |
| Public Health Nuisances | Health Systems and Public Safety | 73.9 | 56 | Middle | 4.00 |
| Food Desert | Neighborhood Characteristics | 100.0% | 56 | Middle | 2.00 |
| Household Transportation Costs | Transportation | 25.6% | 58 | Middle | 4.00 |
| Employment Rate | Employment Opportunities | 80.4% | 65 | Middle | 1.00 |
| Vacancy Rates | Housing | 23.8% | 67 | Bottom | 1.00 |
| Pedestrian & Bicycle Injuries by Motor Vehicles | Health Systems and Public Safety | 0.3 | 67 | Bottom | 4.00 |
| Infant Mortality Rate | Health Systems and Public Safety | 15.8 | 67 | Bottom | 1.00 |
| Proximity to Superfund Sites | Environmental Hazards | 10.9% | 68 | Bottom | 1.00 |
| Travel Time to Work | Employment Opportunities | 26.2 | 68 | Bottom | 1.00 |
| Residential Mobility | Social Cohesion | 78.7% | 70 | Bottom | 1.00 |
| Long-Term Unemployment | Employment Opportunities | 4.7% | 71 | Bottom | 1.00 |
| Residential Proximity to Traffic | Environmental Hazards | 2.8% | 72 | Bottom | 1.00 |
| Access to Mainstream Financial Services | Economic Health | 24.7% | 75 | Bottom | 1.00 |
| Pedestrian Connectivity | Transportation | 40 | 83 | Bottom | 4.00 |
| Violent Crime | Health Systems and Public Safety | 185.2 | 86 | Bottom | 4.00 |
| Preschool Enrollment | Educational Opportunities | 0.2% | 86 | Bottom | 3.00 |
| Offsite Alcohol Outlets | Neighborhood Characteristics | 2.1 | 88 | Bottom | 1.00 |
| Payday Loans | Economic Health | 3.1 | 90 | Bottom | 1.00 |
| Abandoned Structures | Blight | 20.5% | 91 | Bottom | 5.00 |
| Local Business Vitality | Economic Health | 31.9% | 96 | Bottom | 1.00 |
| Motor Vehicle Collisions | Health Systems and Public Safety | 47.5 | 97 | Bottom | 4.00 |
Demographic and Contextual Indicators
| Neighborhood | City Wide | |
|---|---|---|
| Income Inequality | 0.4 | 0.49 |
| Concentrated Poverty | 24.3% | 30.9% |
| Life Expectancy | 70.1 | 78.8 |
| Population | 960 | 210,616 |
| Racial and Ethnic Diversity | 0.2 | 0.44 |
| Park Quality | 63.5 |