Woodlawn
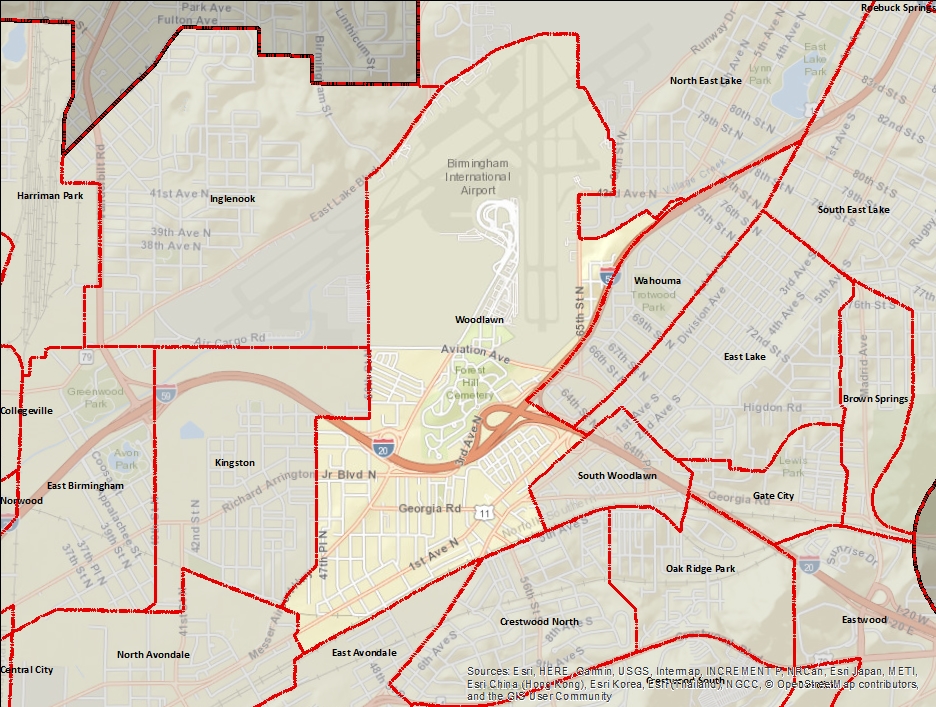
Woodlawn is a neighborhood in the Woodlawn Community. Present-day Woodlawn was settled by a group of farming families who entered the area in 1815, just as it was opened to settlement by the Treaty of Fort Jackson. The community took its name from the Wood family, headed by Obadiah Washington Wood. In 1891 the community was incorporated as the City of Woodlawn. In 1910 the City of Woodlawn was annexed into Birmingham as part of the Greater Birmingham campaign. The neighborhood encompasses a large portion of the Birmingham-Shuttlesworth International Airport and is adjacent to the neighborhoods of Inglenook, Kingston, North East Lake, Wahouma, and South Woodlawn.
Indicator Details
|
Indicators |
Primary Domain | Indicator Value | Rank | Tier | Indicator Weight |
|---|---|---|---|---|---|
| Abandoned Structures | Blight | 15.1% | 68 | Bottom | 5.00 |
| Access to Mainstream Financial Services | Economic Health | 28.1% | 63 | Middle | 1.00 |
| Access to Parks and Open Space | Natural Areas | 79.1% | 71 | Bottom | 1.00 |
| Adult Educational Attainment | Educational Opportunities | 71.5% | 77 | Bottom | 3.00 |
| Age of Housing | Housing | 77.1% | 31 | Top | 1.00 |
| Blood Lead Levels in Children | Housing | -% | - | Data N/A | 1.00 |
| Business Retention | Economic Health | 3.3% | 19 | Top | 1.00 |
| Chronic School Absence | Health Systems and Public Safety | 31.1% | 80 | Bottom | 1.00 |
| Commute Mode Share | Transportation | 20.2% | 36 | Middle | 4.00 |
| Employment Rate | Employment Opportunities | 84.5% | 51 | Middle | 1.00 |
| Excessive Housing Cost Burden | Housing | 36.9% | 38 | Middle | 1.00 |
| Food Desert | Neighborhood Characteristics | 85.7% | 52 | Middle | 2.00 |
| High School Graduation Rate | Educational Opportunities | 72.4% | 86 | Bottom | 3.00 |
| Household Transportation Costs | Transportation | 22.6% | 19 | Top | 4.00 |
| Infant Mortality Rate | Health Systems and Public Safety | 13.1 | 52 | Middle | 1.00 |
| Land Use Mix | Neighborhood Characteristics | 0.7 | 9 | Top | 1.00 |
| Local Business Vitality | Economic Health | 54.5% | 62 | Middle | 1.00 |
| Long-Term Unemployment | Employment Opportunities | 4.1% | 59 | Middle | 1.00 |
| Low Birth Weight | Health Systems and Public Safety | -% | - | Data N/A | 1.00 |
| Motor Vehicle Collisions | Health Systems and Public Safety | 21.9 | 87 | Bottom | 4.00 |
| Offsite Alcohol Outlets | Neighborhood Characteristics | 1.4 | 77 | Bottom | 1.00 |
| Payday Loans | Economic Health | 0.3 | 39 | Middle | 1.00 |
| Pedestrian & Bicycle Injuries by Motor Vehicles | Health Systems and Public Safety | 1.5 | 93 | Bottom | 4.00 |
| Pedestrian Connectivity | Transportation | 120 | 39 | Middle | 4.00 |
| Preschool Enrollment | Educational Opportunities | 55.7% | 5 | Top | 3.00 |
| Preventable Hospitalizations | Health Systems and Public Safety | - | - | Data N/A | 1.00 |
| Proximity to Brownfield Sites | Environmental Hazards | 0.5% | 76 | Bottom | 1.00 |
| Proximity to Superfund Sites | Environmental Hazards | 0.0% | 1 | Top | 1.00 |
| Public Assisted Households | Employment Opportunities | 60.2% | 74 | Bottom | 1.00 |
| Public Health Nuisances | Health Systems and Public Safety | 106.5 | 84 | Bottom | 4.00 |
| Reading Proficiency | Educational Opportunities | 13.1% | 44 | Middle | 3.00 |
| Residential Mobility | Social Cohesion | 89.1% | 23 | Top | 1.00 |
| Residential Proximity to Traffic | Environmental Hazards | 14.6% | 91 | Bottom | 1.00 |
| School Proximity to Traffic | Environmental Hazards | 0.0% | 1 | Top | 1.00 |
| School Readiness Scores | Educational Opportunities | -% | - | Data N/A | 1.00 |
| Tax Delinquent Properties | Blight | 27.3% | 78 | Bottom | 5.00 |
| Toxic Releases from Facilities | Environmental Hazards | 82.2% | 55 | Middle | 1.00 |
| Transit Accessibility | Transportation | 5.9 | 36 | Middle | 4.00 |
| Travel Time to Work | Employment Opportunities | 21.2 | 27 | Top | 1.00 |
| Tree Cover | Natural Areas | 0.4% | 71 | Bottom | 1.00 |
| Vacancy Rates | Housing | 24.5% | 71 | Bottom | 1.00 |
| Violent Crime | Health Systems and Public Safety | 183.6 | 85 | Bottom | 4.00 |
| Visual Property Nuisances | Blight | 37.3% | 97 | Bottom | 5.00 |
| Voter Participation | Social Cohesion | 4.9% | 63 | Middle | 1.00 |
| Walkability | Neighborhood Characteristics | 82 | 7 | Top | 4.00 |
Demographic and Contextual Indicators
| Neighborhood | City Wide | |
|---|---|---|
| Concentrated Poverty | 36.5% | 30.9% |
| Income Inequality | 0.5 | 0.49 |
| Life Expectancy | 71.7 | 78.8 |
| Park Quality | 55 | |
| Population | 2,885 | 210,616 |
| Racial and Ethnic Diversity | 0.5 | 0.44 |