HCI Domains and Indicators

The Healthy Communities Assessment Tool (HCAT) provides planners, community development and neighborhood advocates, and policy makers an understandable way to evaluate community health. The HCAT provides a cumulative ranking of the social, physical and economic environment of every neighborhood based on Healthy Community Index (HCI) core indicators: the higher the rank (i.e., 1 is best), the more supportive the community is of human health and well-being. For example, a neighborhood with an HCAT score of 26 (out of 55 neighborhoods) could be considered to be healthier or have better health prospects than half of the other neighborhoods in the city. Demographic and contextual indicators are not included in the neighborhood score. [Note: In instances where indicator values are tied between neighborhoods, the same ranking will be assigned, e.g., an indicator returns the following five values for neighborhoods A through E, respectively, 93%, 87%, 87%, 84% and 79%. The indicator ranking would follow as A=1; B and C =2, D=4, and E=5.]

The HCAT further splits HCI indicators into three tiers (or tertiles): top, middle and bottom, to show how each indicator ranks relative to other neighborhoods and provide a clearer picture of which determinants of community health are having the greatest effect on the neighborhood’s ranking.

The HCAT also allows users to compare specific indicators to pre-determined benchmarks or goals such as Healthy People 2020 or a City or State designated target (as available).

Learn more about the development of the HCI.

Demographic and Contextual
Demographic and contextual measures are designed to provide an understanding of the overall community and some of the challenges (and opportunities) that specific neighborhoods may encounter. Indicators assigned as demographic and contextual measures have an impact on neighborhood health, but there is limited to no capacity to significantly impact or change them at the neighborhood level. All of the demographic and contextual measures were reviewed across HCI domains, found to be broader than one domain, and fundamentally vital to community health. Although indicators represented in this domain will not be included in neighborhood rankings/scores, nor will the indicators appear in neighborhood comparisons. These measures are simply meant to provide contextual information essential to understanding a neighborhood and its potential to impact key factors of community health.
Indicators Short Description
Concentrated Poverty

Proportion of residents at or below the poverty level.

Income Inequality

A measure of the distribution of income (i.e., the gap between rich and poor).

Life Expectancy Life expectancy is the average number of years an individual can expect to live
Park Quality

Comprehensive rating system measuring how U.S. cities are meeting the need for quality parks.

Population

Number of residents within the neighborhood compared to the overall city.

Racial and Ethnic Diversity

Measure of the extent to which several different racial and ethnic groups are present in a community. Indicator values are calculated and reported using the Simpson Diversity Index.

Blight
The Blight domain is designed to measure the severity of physical decay in each neighborhood based on the prevalence of abandoned, tax delinquent, deteriorated, dilapidated and overgrown properties. Nearly a century-old issue, blight has become more pervasive in an economic context of deindustrialization and out-migration. Blight is considered a public nuisance that does not allow an individual or community members to enjoy the full value or the potential functional value of their neighborhood. Furthermore, it is a reflection of physical and social conditions of a neighborhood. Social science researchers, and increasingly policy makers, recognize the importance of contextual level factors shaping individual-level behavior. Blight is a costly social dilemma; it requires code enforcement, and can lead to citations, demolitions, etc. More importantly, it is a drain on tax revenues. Blight is associated with high youth violence, illegal drug activities, and low social networks and cohesion. In all, blight reduces neighborhood health and quality life and impedes access to safe and secure environments, both of which are important for promoting a strong social infrastructure.
Indicators Short Description
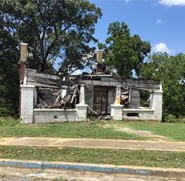
Abandoned Structures

Proportion of properties that mail has not been picked up from or delivered to in more than 90 days.

Tax Delinquent Properties

The proportion of properties that are tax delinquent in a neighborhood.

Visual Property Nuisances

The proportion of properties that are deteriorated, dilapidated, and overgrown in a neighborhood.

Economic Health
Economic health indicators measure the fiscal well-being of a community and its residents. Economic factors have a strong influence on health outcomes and community health. Indicators within this domain focus on economic growth and status, such as business retention and vitality, and access to mainstream financial services, because they reflect a community’s purchasing power, ability to reduce poverty, and availability of public services, all of which contribute to health outcomes. Communities with strong economic health often allow local governments to increase expenditures on programs and infrastructure that expand access to active living opportunities. Indicators for other economic factors such as income inequality and unemployment, which impact community health, can be found under other domains.
Indicators Short Description
Access to Mainstream Financial Services Proportion banked residents in the neighborhood defined by savings account usage.
Business Retention

Percent change in number of neighborhood businesses from the previous year.

Local Business Vitality

Proportion of small (0-4 employees), locally-owned businesses within a neighborhood.

Payday Loans

The number of payday loans per 1,000 residents within one mile of a neighborhood.

Educational Opportunities
Indicators within the Educational Opportunities domain measure how well our systems are training community residents and giving them the tools necessary to move up the economic ladder. Numerous studies have documented the strong relationship between educational opportunities and health, including several reviews examining educational attainment, educational health resources, education accessibility, and school environment. Most people value health highly and health benefits related to education often outweigh financial benefits. Education factors with a connection to community health span the stages or levels of education, including early childhood, K-12, and adult education. Education indicators related to health range from the ratio of teachers to students and the percent of residents with higher levels of education, to the types of extracurricular and after-school activities available. Indicators within the HCI Educational Opportunities domain address educational attainment and key childhood education measures that are found to be indicators of potential education achievement.
Indicators Short Description
Adult Educational Attainment

Proportion of neighborhood adults, aged 25 and older, with a high school diploma (or equivalent).

High School Graduation Rate

Proportion of students entering neighborhood secondary schools that graduate.

Preschool Enrollment

Proportion of three and four year-olds in the neighborhood enrolled in preschool.

Reading Proficiency

Proportion of third or fourth grade students meeting or exceeding "proficient" reading levels on standardized assessments in neighborhood schools.

School Readiness Scores

Proportion of neighborhood kindergarteners prepared for first grade.

Employment Opportunities
Employment measures can range from occupational training to rates of employment and job satisfaction. Numerous studies show a strong correlation between employment and health, with causal impacts going in both directions, i.e., employment effects health and health effects employment. Economic security, be it through employment or other means, has been shown to be one of the strongest and most consistent predictors of health and disease. Although there are references in literature to the health impacts of job satisfaction, jobs and housing balance, and benefits associated with full-time employment, most studies on the public health effects of employment opportunities focus primarily on the connection between health and income, self-sufficiency, and health and poverty. Indicators within this domain measure a household’s self-sufficiency, i.e., ability to earn enough income without receiving community and/or government assistance; commute time; and rates of both employment and long-term unemployment.
Indicators Short Description
Employment Rate

Proportion of neighborhood working age residents (15 - 64 years) employed.

Long-Term Unemployment

Proportion of the neighborhood’s working population (i.e., age 16 and up) unemployed for more than 12 months.

Public Assisted Households

Proportion of neighborhood households receiving public assistance in the form of Supplemental Security Income (SSI), cash public assistance and/or Food stamps/SNAP.

Travel Time to Work

Average amount of time (in minutes) it takes a neighborhood resident to commute to work.

Environmental Hazards
Environmental hazards are generally defined as natural and manmade events that have harmful impacts on the surrounding natural environment and adversely impact public health. Studies on the public health impacts of environmental hazards focus primarily on exposure to toxic chemicals through air, water, and soil. Other areas address the adverse health impacts of noise, lead exposure in children, and greenhouse gases. Health impacts from exposure to environmental hazards can range from minor respiratory and skin irritations to death, and have a significant impact on populations, such as the low-income, whose health status is already at risk. Neighborhood environmental hazards are challenging to assess as national monitoring systems typically do not measure or estimate environmental exposure at the neighborhood level. Indicators within the Environmental Hazards domain are designed to measure the proportion of a neighborhood impacted by toxic releases from nearby facilities, noise and air pollution related to major highways and streets, and the impact of proximity to hazardous sites such as Brownfields and Superfunds.
Indicators Short Description
Proximity to Brownfield Sites

Proportion of the neighborhood population located near a Brownfield site.

Proximity to Superfund Sites

Proportion of neighborhood population located in close proximity to an active Superfund site.

Residential Proximity to Traffic

Proportion of a neighborhood population located near roads with heavy traffic.

School Proximity to Traffic

Proportion of neighborhood schools located near roads with a high volume of traffic.

Toxic Releases from Facilities

Proportion of the neighborhood population located near industrial facilities reporting toxic air emissions.

Health Systems and Public Safety
Healthy Systems and Public Safety concentrates on neighborhood-level measures that speak to the quality and effectiveness of community health systems, broadly defined as public and private organizations, services, and institutions developed to protect and promote health and well-being. Indicators included in the domain reflect the quality of health systems, and measure factors such as preventable hospitalizations, school absence, birth weight, and crime.
Indicators Short Description
Chronic School Absence

Proportion of students chronically absent from neighborhood schools (i.e., missing more than 10% school days).

Infant Mortality Rate

The infant mortality rate refers to the probability of dying between birth and 1 year of age, expressed per 1,000 live births.

Low Birth Weight

Proportion of infants born with low birth weight (< 2500 grams).

Motor Vehicle Collisions

Annual incidence of motor vehicle collision injuries and fatalities per 1000 people for all modes of transportation on public roadways and right of ways.

Pedestrian & Bicycle Injuries by Motor Vehicles

The annual number of injuries to a pedestrian or bicyclist by a motor vehicle on public roadways and rights of way per 1,000 people in a neighborhood.

Preventable Hospitalizations

Age-adjusted hospitalization rate for conditions where appropriate outpatient care prevents or reduces the need for a patient to be admitted to the hospital.

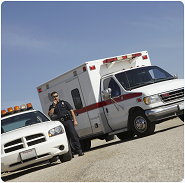
Public Health Nuisances

The number of reported public health nuisances per 1,000 residents.

Violent Crime

Annual rate of reported incidents of violent crime per 1000 residents.

Housing
Housing can include a range of issues from housing starts, residential density, and foreclosure rates to building conditions. The connection between housing and health is well established. Overcrowding and unhealthy conditions led to the creation of the first housing codes in the early 1900s and most building codes still relate directly to preventing injury to household residents. Housing has the potential to help —or harm—health in many ways: housing quality can effect physiological and psychological health; unaffordable housing can impact the ability to make healthy choices; and negative attributes of the surrounding neighborhood (e.g., blight) can support criminal activities and attract environmental hazards such as trash dumping and rodents. In recent years, a renewed public health interest in healthy housing sparked several studies which show improved health community outcomes from policies focused on housing conditions. The Housing domain includes indicators designed to measure vacancy and potential blight, environmental hazards within a home, and the impact excessive housing costs can have on residents.
Indicators Short Description
Age of Housing

Proportion of neighborhood housing built prior to 1980.

Blood Lead Levels in Children

Proportion of children tested for lead with a blood level over 5 µg/dL.

Excessive Housing Cost Burden

Proportion of neighborhood households whose housing costs are 35% or more of their gross income.

Vacancy Rates

Proportion of vacant residential properties.

Natural Areas
Natural areas are water and land areas generally associated with wildlife and ecological features, such as waterways, wetlands, open space and parks, forests and trees, and even farms or gardens. Natural areas provide measurable health benefits ranging from the ability to commune with nature and the outdoors, which has been shown to have restorative health effects, to opportunities for physical activity and social interaction. Studies about the impacts of natural areas on public health focus primarily on tree cover, impervious surfaces, waterways, and access to amenities such parks and open space. In addition to the immediate impact natural areas may have on individuals, such as increased fitness and reduced obesity, natural areas help mitigate climate, air, and water pollution issues within a community. Indicators within the Natural Areas domain capture the proportion of a neighborhood with access to parks and open space and adequate tree cover.
Indicators Short Description
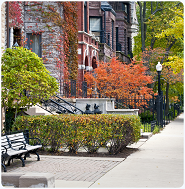
Access to Parks and Open Space

The proportion of a neighborhood’s population within a half mile (10 minute walk) of a park.

Tree Cover

Proportion of the neighborhood with tree coverage.

Neighborhood Characteristics
Neighborhood characteristics range from the availability of amenities and retail to built environment infrastructure issues to the level of community services. Studies show that the design of a neighborhood, along with its characteristics and availability of resources, has a strong impact on community health: large disparities exist between low-income, racially segregated neighborhoods compared to higher-income, diverse neighborhoods in relation to healthy food, infrastructure improvements, availability of community services, access to amenities, and green space. Measures within Neighborhood Characteristics focus primarily on the connection between health and availability of healthy food sources and access to retail and business. These measures are linked to economic health, health systems and public safety, and employment. A myriad of other measures related to neighborhood characteristics may be found under other domains within the HCI, including housing, social cohesion, education, and natural areas.
Indicators Short Description
Food Desert

Proportion of a neighborhood that is low income and has no access to affordable, healthy food.

Land Use Mix

The average neighborhood-level diversity of destinations based on the mix of eight different employment types (office, retail, industrial, service, entertainment, education, health, and public sector) and reported using the Simpson Diversity Index.

Offsite Alcohol Outlets

Number of stores selling alcohol for “off-site” consumption per 1,000 people.

Walkability

A score of how pedestrian-friendly, i.e., walkable to amenities and common destinations, within a neighborhood.

Social Cohesion
Social cohesion measures attempt to assess how engaged and connected community members are to each other and to the community itself. Studies have found social cohesion is linked to high self-ratings of health and lower rates of mental illness and hopelessness within a community. Socially cohesive communities provide important support systems and a sense of belonging and well-being. Although quantifying the degree to which a community is socially cohesive is inherently difficult, studies on public health impacts tend to target the concepts of social capital, social inclusion, and racial discrimination and segregation. Longevity within the community, combined with participation in activities ranging from the electoral process to a social club or sports team appear to be major determinants of social cohesion.
Indicators Short Description
Residential Mobility

Proportion of neighborhood residents, age one year and older, living in the same house as the previous year.

Voter Participation

Proportion of voting eligible neighborhood residents who voted in the last election.

Transportation
Transportation services cover a range of issues including access to public transit, traffic and congestion, pedestrian and road connectivity, and vehicle miles traveled (VMT). A healthy community promotes transportation systems and services that provide alternatives for how residents get to work and standard destinations, good public transit options, affordable transportation choices, and walkable neighborhoods. Transportation studies related to public health generally focus on three outcomes: reduced traffic-related air pollution, reduced vehicle collisions, and reduced levels of obesity due to increased levels of physical activity related to the use of active transportation options. Active transportation options include walking, biking and any other method of travel that involves human energy. Transportation indicators overlap significantly with other domains such as environmental hazards and public health and safety, and neighborhood characteristics. To capture unique community health outcomes, indicators under Transportation Services include access to transit, how residents travel to work, how walkable community neighborhoods are, and the impact transportation costs have on households.
Indicators Short Description
Commute Mode Share

Proportion of neighborhood residents commuting to work by transit, bicycle, foot, or carpool.

Household Transportation Costs

Proportion of household income spent on transportation.

Pedestrian Connectivity

Density of pedestrian-oriented intersections within a neighborhood (i.e., a measure of how well sidewalks and streets are connected, and intersections spaced to allow residents to easily walk or bike around the neighborhood). Indicator values are reported as a score.

Transit Accessibility

Frequency of transit service within a .25-mile during peak evening hours.