Fairview
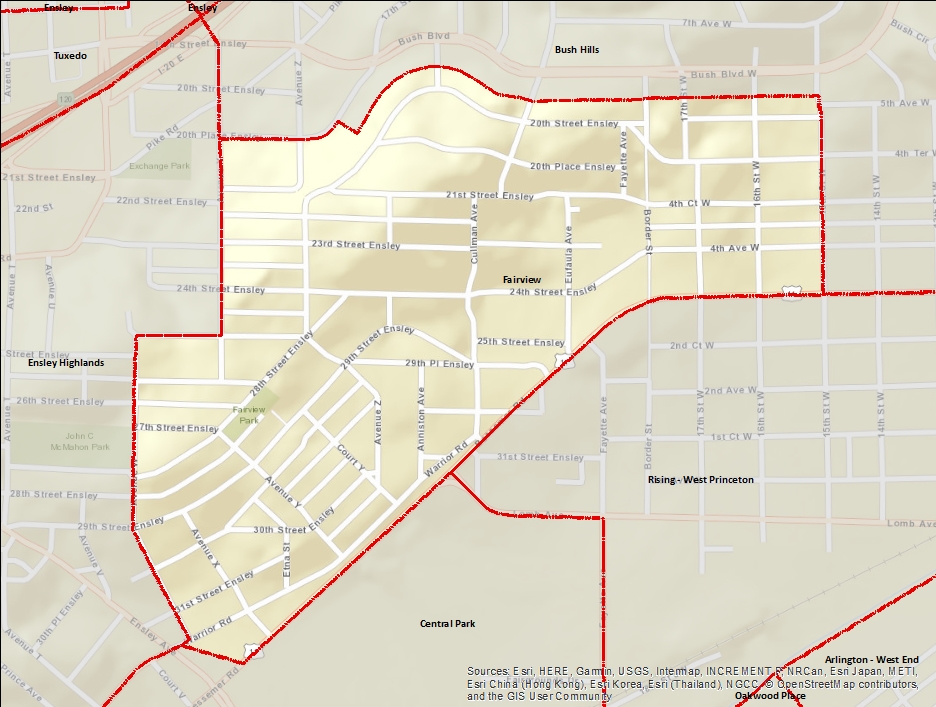
Fairview is a neighborhood in Birmingham's Five Points West community. It lies north of the Alabama State Fairgrounds, Central Park and Rising-West Princeton, south and west of Bush Hills, and east of Ensley Highlands. In the center of the community was a spring that flowed into Village Creek. The Seminole chief Osceola was known to camp in the area in the early 19th Century- around 1820 or so. The street car stop near the fairgrounds was named Osceola Station in his honor.
Indicator Details
|
Indicators |
Primary Domain | Indicator Value | Rank | Tier | Indicator Weight |
|---|---|---|---|---|---|
| Abandoned Structures | Blight | 20.8% | 93 | Bottom | 5.00 |
| Access to Mainstream Financial Services | Economic Health | 27.9% | 66 | Middle | 1.00 |
| Access to Parks and Open Space | Natural Areas | 93.8% | 49 | Middle | 1.00 |
| Adult Educational Attainment | Educational Opportunities | 82.1% | 33 | Top | 3.00 |
| Age of Housing | Housing | 91.6% | 84 | Bottom | 1.00 |
| Blood Lead Levels in Children | Housing | -% | - | Data N/A | 1.00 |
| Business Retention | Economic Health | -18.9% | 83 | Bottom | 1.00 |
| Chronic School Absence | Health Systems and Public Safety | 24.5% | 48 | Middle | 1.00 |
| Commute Mode Share | Transportation | 7.0% | 89 | Bottom | 4.00 |
| Employment Rate | Employment Opportunities | 87.3% | 31 | Top | 1.00 |
| Excessive Housing Cost Burden | Housing | 49.4% | 85 | Bottom | 1.00 |
| Food Desert | Neighborhood Characteristics | 100.0% | 56 | Middle | 2.00 |
| High School Graduation Rate | Educational Opportunities | 75.8% | 65 | Middle | 3.00 |
| Household Transportation Costs | Transportation | 23.7% | 32 | Top | 4.00 |
| Infant Mortality Rate | Health Systems and Public Safety | 17.7 | 81 | Bottom | 1.00 |
| Land Use Mix | Neighborhood Characteristics | 0.6 | 39 | Middle | 1.00 |
| Local Business Vitality | Economic Health | 76.7% | 16 | Top | 1.00 |
| Long-Term Unemployment | Employment Opportunities | 2.5% | 28 | Top | 1.00 |
| Low Birth Weight | Health Systems and Public Safety | -% | - | Data N/A | 1.00 |
| Motor Vehicle Collisions | Health Systems and Public Safety | 1.4 | 13 | Top | 4.00 |
| Offsite Alcohol Outlets | Neighborhood Characteristics | 0 | 1 | Top | 1.00 |
| Payday Loans | Economic Health | 1.7 | 78 | Bottom | 1.00 |
| Pedestrian & Bicycle Injuries by Motor Vehicles | Health Systems and Public Safety | 0 | 1 | Top | 4.00 |
| Pedestrian Connectivity | Transportation | 186 | 4 | Top | 4.00 |
| Preschool Enrollment | Educational Opportunities | 27.9% | 32 | Top | 3.00 |
| Preventable Hospitalizations | Health Systems and Public Safety | - | - | Data N/A | 1.00 |
| Proximity to Brownfield Sites | Environmental Hazards | 0.0% | 1 | Top | 1.00 |
| Proximity to Superfund Sites | Environmental Hazards | 0.0% | 1 | Top | 1.00 |
| Public Assisted Households | Employment Opportunities | 58.9% | 70 | Bottom | 1.00 |
| Public Health Nuisances | Health Systems and Public Safety | 79.3 | 62 | Middle | 4.00 |
| Reading Proficiency | Educational Opportunities | 23.2% | 3 | Top | 3.00 |
| Residential Mobility | Social Cohesion | 84.1% | 46 | Middle | 1.00 |
| Residential Proximity to Traffic | Environmental Hazards | 0.0% | 1 | Top | 1.00 |
| School Proximity to Traffic | Environmental Hazards | 0.0% | 1 | Top | 1.00 |
| School Readiness Scores | Educational Opportunities | -% | - | Data N/A | 1.00 |
| Tax Delinquent Properties | Blight | 20.6% | 56 | Middle | 5.00 |
| Toxic Releases from Facilities | Environmental Hazards | 85.4% | 61 | Middle | 1.00 |
| Transit Accessibility | Transportation | 6.2 | 32 | Top | 4.00 |
| Travel Time to Work | Employment Opportunities | 23.9 | 38 | Middle | 1.00 |
| Tree Cover | Natural Areas | 0.0% | 77 | Bottom | 1.00 |
| Vacancy Rates | Housing | 30.9% | 90 | Bottom | 1.00 |
| Violent Crime | Health Systems and Public Safety | 131.8 | 72 | Bottom | 4.00 |
| Visual Property Nuisances | Blight | 25.0% | 80 | Bottom | 5.00 |
| Voter Participation | Social Cohesion | 4.5% | 76 | Bottom | 1.00 |
| Walkability | Neighborhood Characteristics | 76 | 22 | Top | 4.00 |
Demographic and Contextual Indicators
| Neighborhood | City Wide | |
|---|---|---|
| Concentrated Poverty | 33.3% | 30.9% |
| Income Inequality | 0.4 | 0.49 |
| Life Expectancy | 70.5 | 78.8 |
| Park Quality | 51.9 | |
| Population | 2,306 | 210,616 |
| Racial and Ethnic Diversity | 0.1 | 0.44 |