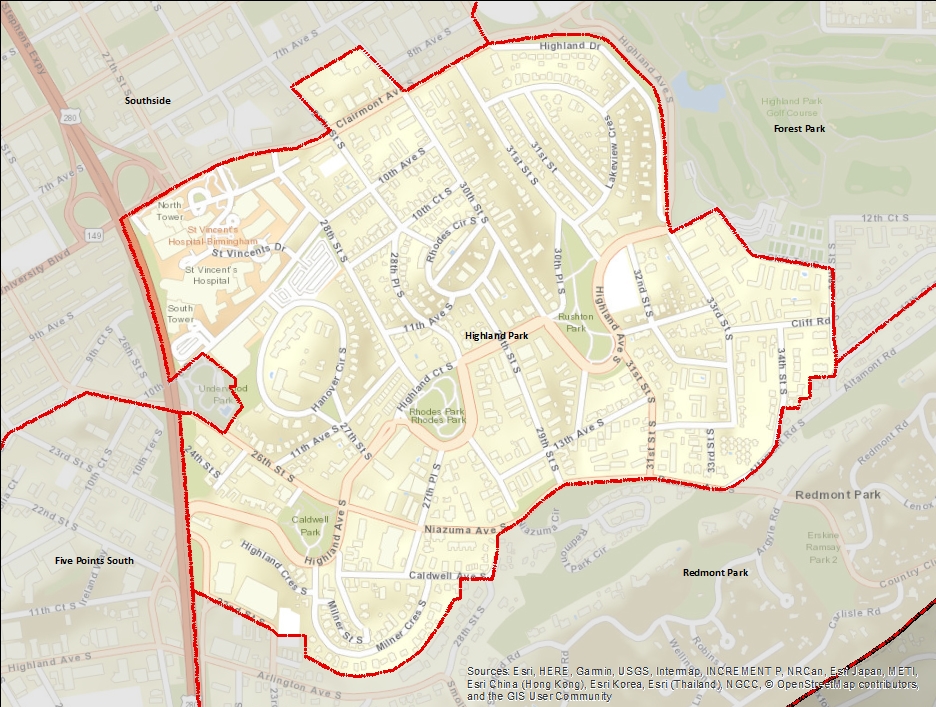
Highland Park
Highland Park is a neighborhood in Birmingham's Red Mountain community, centered on Highland Avenue in Southside, at the base of the north slope of Red Mountain. Most of the neighborhood's residential areas were developed by the Elyton Land Company as a streetcar suburb offering estate-size lots above the smog of Jones Valley. The neighborhood's curvilinear streets and bowl-shaped parks take advantage of topography for both practical and aesthetic purposes.
Indicator Details
| Indicators |
Primary Domain |
Indicator Value | Rank | Tier | Indicator Weight |
|---|---|---|---|---|---|
| Payday Loans | Economic Health | 0.2 | 35 | Middle | 1.00 |
| Business Retention | Economic Health | -16.0% | 75 | Bottom | 1.00 |
| Access to Mainstream Financial Services | Economic Health | 53.9% | 9 | Top | 1.00 |
| Local Business Vitality | Economic Health | 67.7% | 27 | Top | 1.00 |
| Reading Proficiency | Educational Opportunities | 10.3% | 62 | Middle | 3.00 |
| Adult Educational Attainment | Educational Opportunities | 92.8% | 3 | Top | 3.00 |
| High School Graduation Rate | Educational Opportunities | 75.9% | 57 | Middle | 3.00 |
| School Readiness Scores | Educational Opportunities | -% | - | Data N/A | 1.00 |
| Preschool Enrollment | Educational Opportunities | 48.7% | 9 | Top | 3.00 |
| Residential Proximity to Traffic | Environmental Hazards | 8.8% | 82 | Bottom | 1.00 |
| School Proximity to Traffic | Environmental Hazards | 0.0% | 1 | Top | 1.00 |
| Proximity to Brownfield Sites | Environmental Hazards | 0.0% | 1 | Top | 1.00 |
| Toxic Releases from Facilities | Environmental Hazards | 97.0% | 70 | Bottom | 1.00 |
| Proximity to Superfund Sites | Environmental Hazards | 33.4% | 77 | Bottom | 1.00 |
| Travel Time to Work | Employment Opportunities | 15.8 | 2 | Top | 1.00 |
| Public Assisted Households | Employment Opportunities | 10.9% | 7 | Top | 1.00 |
| Employment Rate | Employment Opportunities | 94.3% | 8 | Top | 1.00 |
| Long-Term Unemployment | Employment Opportunities | 0.8% | 3 | Top | 1.00 |
| Vacancy Rates | Housing | 13.9% | 31 | Top | 1.00 |
| Age of Housing | Housing | 81.2% | 39 | Middle | 1.00 |
| Blood Lead Levels in Children | Housing | -% | - | Data N/A | 1.00 |
| Excessive Housing Cost Burden | Housing | 29.4% | 12 | Top | 1.00 |
| Preventable Hospitalizations | Health Systems and Public Safety | - | - | Data N/A | 1.00 |
| Pedestrian & Bicycle Injuries by Motor Vehicles | Health Systems and Public Safety | 0.2 | 55 | Middle | 4.00 |
| Public Health Nuisances | Health Systems and Public Safety | 12 | 6 | Top | 4.00 |
| Infant Mortality Rate | Health Systems and Public Safety | 14.4 | 61 | Middle | 1.00 |
| Violent Crime | Health Systems and Public Safety | 33 | 6 | Top | 4.00 |
| Chronic School Absence | Health Systems and Public Safety | 20.3% | 40 | Middle | 1.00 |
| Low Birth Weight | Health Systems and Public Safety | -% | - | Data N/A | 1.00 |
| Motor Vehicle Collisions | Health Systems and Public Safety | 1.4 | 13 | Top | 4.00 |
| Tree Cover | Natural Areas | 0.0% | 77 | Bottom | 1.00 |
| Access to Parks and Open Space | Natural Areas | 100.0% | 1 | Top | 1.00 |
| Land Use Mix | Neighborhood Characteristics | 0.5 | 64 | Middle | 1.00 |
| Walkability | Neighborhood Characteristics | 49.3 | 53 | Middle | 4.00 |
| Offsite Alcohol Outlets | Neighborhood Characteristics | 0 | 1 | Top | 1.00 |
| Food Desert | Neighborhood Characteristics | 27.3% | 4 | Top | 2.00 |
| Residential Mobility | Social Cohesion | 71.5% | 89 | Bottom | 1.00 |
| Voter Participation | Social Cohesion | 5.9% | 41 | Middle | 1.00 |
| Transit Accessibility | Transportation | 5.4 | 41 | Middle | 4.00 |
| Commute Mode Share | Transportation | 7.7% | 88 | Bottom | 4.00 |
| Pedestrian Connectivity | Transportation | 172 | 11 | Top | 4.00 |
| Household Transportation Costs | Transportation | 18.9% | 3 | Top | 4.00 |
| Abandoned Structures | Blight | 4.0% | 13 | Top | 5.00 |
| Tax Delinquent Properties | Blight | 0.7% | 6 | Top | 5.00 |
| Visual Property Nuisances | Blight | 1.8% | 9 | Top | 5.00 |
Demographic and Contextual Indicators
| Neighborhood | City Wide | |
|---|---|---|
| Income Inequality | 0.5 | 0.49 |
| Concentrated Poverty | 19.1% | 30.9% |
| Life Expectancy | 78.8 | 78.8 |
| Population | 5,569 | 210,616 |
| Racial and Ethnic Diversity | 0.4 | 0.44 |
| Park Quality | 73.8 |